
Technical analysis offers a vast toolkit for traders seeking to decipher price movements and identify potential trading opportunities. Among these tools, Fibonacci retracements stand out for their elegance and widespread application. Based on the mathematical sequence discovered by Leonardo Fibonacci in the 13th century, these retracement levels can help traders pinpoint potential areas of support and resistance, offering valuable insights for trade entries, exits, and setting stop-loss orders. This comprehensive guide will delve into the intricacies of Fibonacci retracements, explaining their calculation, interpretation, and practical application within various trading strategies, ultimately helping you integrate this powerful tool into a style that suits your individual trading lifestyle. For a foundational understanding of technical analysis and its tools, resources like those available on Investopedia are invaluable: Technical Analysis Basics.
Understanding the Fibonacci Sequence and Ratios
Decoding Fibonacci: The Foundation of Retracement Levels
The Fibonacci sequence is a series of numbers where each number is the sum of the two preceding ones, typically starting with 0 and 1: 0, 1, 1, 2, 3, 5, 8, 13, 21, and so on. The fascinating aspect of this sequence lies in the mathematical relationships between its numbers, which give rise to the Fibonacci ratios. These ratios are the cornerstone of Fibonacci retracement analysis. You can explore the mathematical basis of the Fibonacci sequence on websites dedicated to mathematics and finance, such as Wolfram MathWorld: Fibonacci Numbers.
Key Fibonacci Ratios Used in Trading
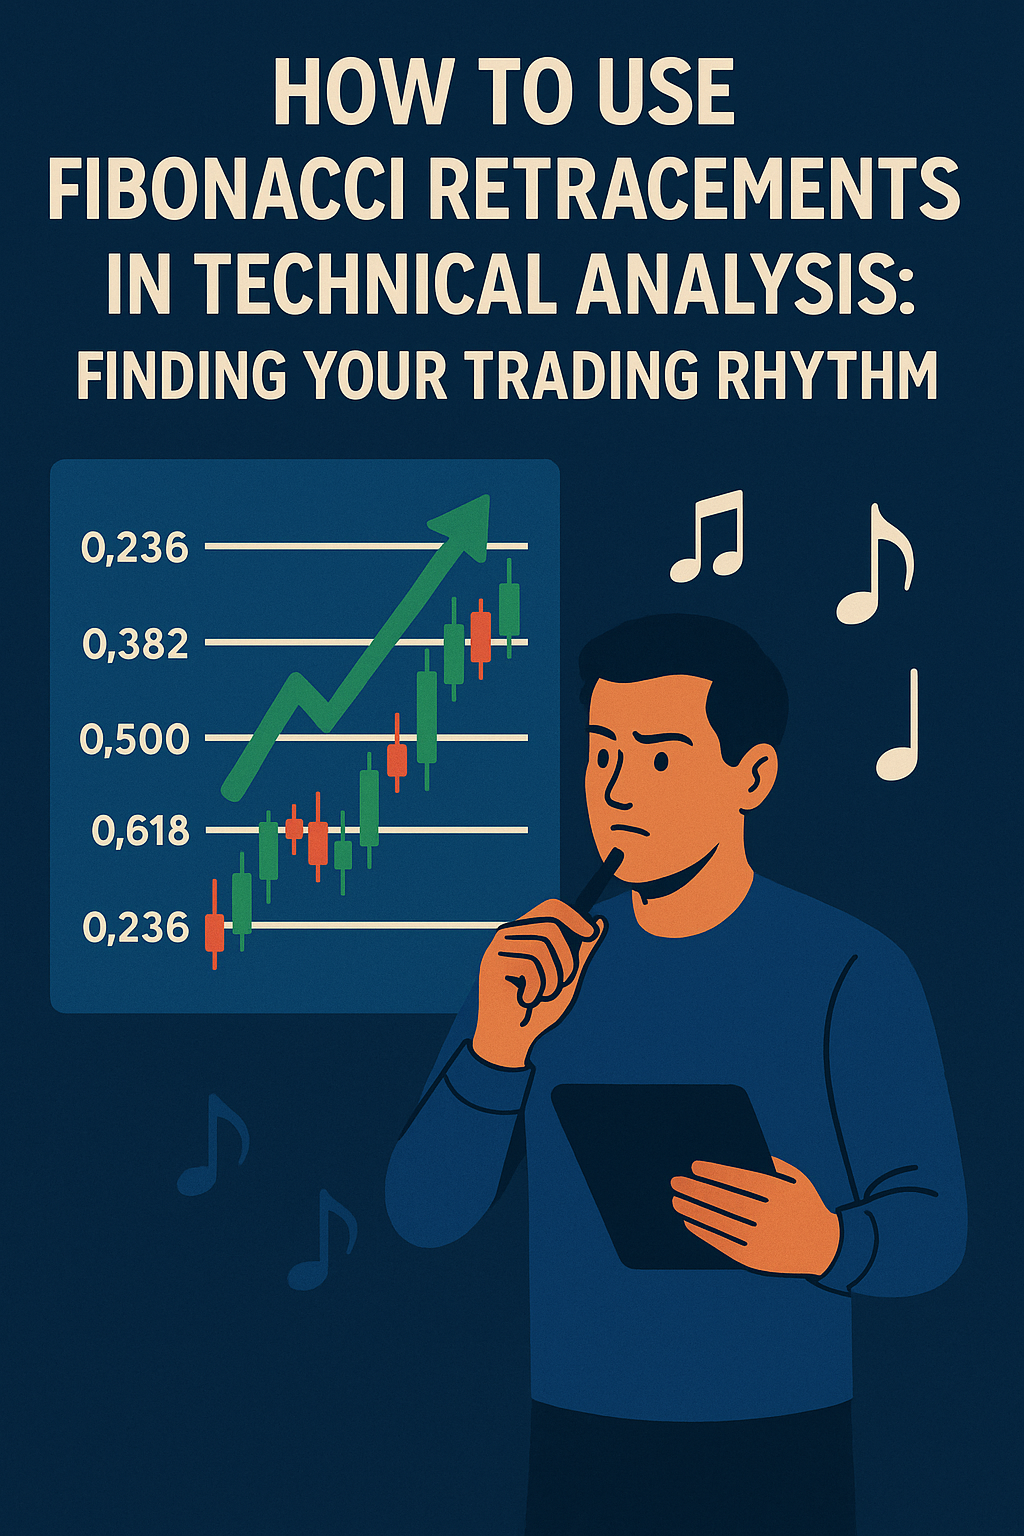
The most commonly used Fibonacci ratios in technical analysis are derived from the relationships within the sequence:

- 61.8% (The Golden Ratio): This ratio is obtained by dividing any number in the sequence by the number that follows it (e.g., 8 / 13 ≈ 0.615, 21 / 34 ≈ 0.618). It’s often considered a significant level of potential support or resistance.
- 38.2%: This ratio is derived by dividing a number in the sequence by the number two places after it (e.g., 8 / 21 ≈ 0.381, 13 / 34 ≈ 0.382). It represents a shallower retracement level.
- 23.6%: This ratio is obtained by dividing a number in the sequence by the number three places after it (e.g., 8 / 34 ≈ 0.235, 13 / 55 ≈ 0.236). It represents an even shallower retracement level and is sometimes used for very short-term analysis.
- 50%: While not strictly a Fibonacci ratio, the 50% retracement level is widely observed by traders as a potential area of support or resistance, representing the midpoint of a price swing. Many technical analysis platforms include this level by default.
- 78.6%: This ratio is the square root of 61.8% and is gaining popularity as another potential retracement level.
These percentages are plotted on a price chart to identify potential levels where the price might retrace after a significant move before continuing in the original direction. Understanding how these ratios are calculated can provide a deeper appreciation for their application in trading.
Plotting Fibonacci Retracement Levels on a Chart
Drawing Fibonacci Retracements: A Step-by-Step Guide
Most modern charting platforms have built-in Fibonacci retracement tools that make plotting these levels straightforward. The basic process involves identifying a significant swing high and a significant swing low (or vice versa for downtrends). A swing high is a peak on the chart followed by lower prices, while a swing low is a trough followed by higher prices.
Steps for Plotting Fibonacci Retracements:
- Identify the Trend: Determine the prevailing trend. Fibonacci retracements are most effective when applied within the context of an established uptrend or downtrend.
- Locate the Swing Points: Identify the beginning and end of a significant price swing. For an uptrend, this would be a swing low to a subsequent swing high. For a downtrend, it would be a swing high to a subsequent swing low.
- Select the Fibonacci Tool: Choose the Fibonacci retracement tool on your charting platform.
- Draw the Retracement: Click and drag the tool from the beginning swing point to the ending swing point of the identified price move.
- Interpret the Levels: The charting platform will automatically draw horizontal lines at the Fibonacci retracement levels (23.6%, 38.2%, 50%, 61.8%, and sometimes 78.6%) between the chosen swing high and low.
Example of Plotting in an Uptrend:

In an uptrend, you would draw the Fibonacci retracement tool from the swing low to the swing high. The retracement levels will then act as potential areas of support where the price might pull back before continuing its upward journey. Traders often watch for the price to bounce off one of these levels. Many online resources and video tutorials demonstrate how to plot Fibonacci retracements on specific charting platforms like TradingView: TradingView Fibonacci Tutorial.
Example of Plotting in a Downtrend:
In a downtrend, you would draw the Fibonacci retracement tool from the swing high to the swing low. The retracement levels will then act as potential areas of resistance where the price might rally before continuing its downward trajectory. Traders often look for the price to stall or reverse at these levels.
Interpreting Fibonacci Retracement Levels in Trading
Decoding the Signals: Interpreting Fibonacci Levels

Once Fibonacci retracement levels are plotted on a chart, the key is to understand how to interpret them as potential areas of interest for traders. These levels are not guaranteed points of support or resistance, but rather zones of probability where buying or selling pressure may increase. Understanding the confluence of these levels with other technical indicators can enhance their significance.
Potential Support and Resistance Zones:
- Shallow Retracements (23.6%, 38.2%): These levels often indicate strong momentum in the prevailing trend. If the price retraces only to these shallow levels and then bounces, it suggests the trend is likely to continue with force.
- Intermediate Retracement (50%): While not a true Fibonacci ratio, the 50% level is a psychologically significant area and can often act as support or resistance.
- Deep Retracements (61.8%, 78.6%): These levels are often considered key areas for potential trend continuation. A retracement to the 61.8% level, in particular, is closely watched by many traders as a high-probability reversal zone within the existing trend. A break below the 78.6% level might suggest a weakening of the trend.
Confluence with Other Technical Indicators:
The power of Fibonacci retracements can be significantly enhanced when used in conjunction with other technical analysis tools. This confluence of signals can provide stronger confirmation of potential support or resistance levels. Examples include:

- Moving Averages: If a Fibonacci retracement level coincides with a significant moving average (e.g., the 50-day or 200-day MA), the area becomes a stronger zone of potential support or resistance. You can find information on how to combine moving averages with other indicators on broker platforms like Fidelity: Using Moving Averages.
- Trendlines: If a Fibonacci retracement level aligns with a well-established trendline, it can add further conviction to a potential reversal point.
- Pivot Points: The intersection of Fibonacci levels with daily, weekly, or monthly pivot points can create high-probability trading zones. Information on pivot points can be found on resources like DailyFX: Pivot Point Trading.
- Candlestick Patterns: Reversal candlestick patterns (e.g., bullish engulfing, bearish engulfing, doji) forming at Fibonacci retracement levels can provide strong entry signals. A good resource for learning about candlestick patterns is Investopedia: Candlestick Patterns.
- Volume Analysis: Observing a decrease in volume during the retracement and an increase in volume upon reaching a Fibonacci level and reversing can provide further confirmation of the level’s significance.
Using Fibonacci Extensions:
Beyond retracements, Fibonacci extensions are used to project potential price targets after a retracement has occurred. Common extension levels include 127.2%, 161.8%, and 261.8%. These levels are plotted beyond the swing high (in an uptrend) or swing low (in a downtrend) and can help traders identify potential profit-taking areas. Tutorials on how to use Fibonacci extensions are available on various charting platform guides, including those on MetaTrader: MetaTrader Fibonacci Tools.
Integrating Fibonacci Retracements into Your Trading Lifestyle
Finding Your Rhythm: Fibonacci Strategies for Different Trading Styles
The versatility of Fibonacci retracements allows them to be incorporated into various trading styles, from short-term day trading to longer-term swing trading and position trading. The key is to adapt the application of Fibonacci levels to your preferred timeframes and risk tolerance.
Fibonacci in Day Trading:

Day traders can use Fibonacci retracements on intraday charts (e.g., 5-minute, 15-minute) to identify short-term entry and exit points within the context of the day’s prevailing trend. Combining Fibonacci levels with intraday pivot points and short-term moving averages can be particularly effective for identifying high-probability setups. Websites like DayTradeTheWorld provide information on day trading strategies: Day Trading Strategies.
Fibonacci in Swing Trading:
Swing traders often apply Fibonacci retracements to daily and weekly charts to identify potential entry points for trades that aim to capture larger price swings lasting several days to weeks. Confluence with longer-term trendlines and moving averages enhances the reliability of Fibonacci levels in this timeframe. Websites like SwingTradeBot offer resources for swing traders: Swing Trading with Fibonacci.
Fibonacci in Position Trading:

Position traders, who hold trades for weeks to months, can use Fibonacci retracements on weekly and monthly charts to identify strategic entry points within long-term trends. Retracements to key Fibonacci levels on these higher timeframes can offer low-risk entry opportunities with significant potential upside.
Combining Fibonacci with Different Trading Methodologies:
Fibonacci retracements can also be integrated with various trading methodologies, such as:
- Trend Following: Using Fibonacci retracements to find low-risk entry points after a pullback within a well-established trend.
- Breakout Trading: Looking for breakouts above or below Fibonacci levels that coincide with other breakout signals.
- Range Trading: Identifying potential buy and sell zones within a trading range using Fibonacci levels as boundaries.
Exploring how Fibonacci can complement your existing trading methodology can lead to more robust and effective trading strategies. Many trading books and online courses delve into combining different technical analysis tools.
Risk Management with Fibonacci Retracements
Protecting Your Capital: Risk Management with Fibonacci Levels
Fibonacci retracements are not only useful for identifying potential entry and exit points but also for implementing effective risk management strategies. These levels can help in setting logical stop-loss orders and determining appropriate position sizes.
Setting Stop-Loss Orders:
A common approach is to place stop-loss orders just beyond a significant Fibonacci retracement level. For example, if entering long on a bounce off the 61.8% retracement level in an uptrend, a stop-loss could be placed slightly below this level. This helps to limit potential losses if the price breaks through the expected support. You can find guidance on setting stop-loss orders on broker websites and educational resources.
H2: Determining Position Size:
Fibonacci levels can also indirectly influence position sizing. By identifying high-probability trading zones based on confluence with Fibonacci levels, traders might feel more confident in taking slightly larger positions (while still adhering to sound risk management principles). Conversely, if the confluence is weak, a smaller position size might be more appropriate.
Identifying Potential Take-Profit Levels:
Fibonacci extensions, as mentioned earlier, can be used to identify potential take-profit targets after a trade is initiated based on a Fibonacci retracement. Traders often look for the price to reach extension levels like 161.8% or 261.8% as areas to consider taking profits.
Conclusion: Finding Your Fibonacci Edge
Fibonacci retracements are a powerful and versatile tool that can enhance any technical trader’s arsenal. By understanding the underlying Fibonacci sequence and ratios, learning to plot these levels correctly, and interpreting them within the context of trends and other technical indicators, traders can gain valuable insights into potential support and resistance zones. Integrating Fibonacci retracements into a trading strategy that aligns with your individual lifestyle, risk tolerance, and preferred timeframes can lead to more informed trading decisions and improved risk management. Continuous learning and practice are key to mastering this valuable technical analysis technique.
Reference Link:
For a comprehensive overview of technical analysis and various tools, including Fibonacci retracements, please refer to Investopedia’s section on technical analysis: Technical Analysis
Disclaimer:
This article provides general information about using Fibonacci retracements in technical analysis and should not be considered financial advice. Trading involves significant risks, and past performance is not indicative of future results. The use of Fibonacci retracements, like any technical analysis tool, does not guarantee profits and can lead to losses. It is crucial to conduct thorough research, understand the risks involved, and carefully consider your investment objectives, risk tolerance, and financial situation before making any trading decisions. It is recommended to consult with a qualified financial advisor before making any investment decisions.