
Moving averages are one of the most widely used tools in technical analysis, helping traders identify trends, make informed decisions, and navigate financial markets. Whether you’re trading stocks, forex, cryptocurrencies, or commodities, understanding how to use moving averages effectively can enhance your ability to analyze price movements. In this complete guide to moving averages in trading for 2025, we’ll explore what moving averages are, how they work, their types, strategies, benefits, and limitations. Spanning 4,000 words, this SEO-friendly guide is designed for beginners and intermediate traders, offering a detailed yet accessible overview without providing investment advice.
Table of Contents
- What Are Moving Averages?
- How Do Moving Averages Work?
- Types of Moving Averages
- Popular Moving Average Strategies
- Benefits of Using Moving Averages
- Limitations of Moving Averages
- How to Set Up Moving Averages on Trading Platforms
- Moving Averages in Different Markets
- Common Mistakes When Using Moving Averages
- Advanced Techniques with Moving Averages
- Moving Averages vs. Other Technical Indicators
- The Future of Moving Averages in Trading
- Frequently Asked Questions (FAQs)
- Conclusion
1. What Are Moving Averages?
Definition of Moving Averages
A moving average (MA) is a technical indicator that smooths out price data by calculating the average price of an asset over a specific period. By reducing noise and highlighting trends, moving averages help traders identify the direction of price movements and potential entry or exit points.
Why Are Moving Averages Important?
Moving averages are popular because they are simple to understand, versatile, and applicable across various timeframes and markets. They are used to:
- Identify trends (uptrends, downtrends, or sideways markets).
- Generate trading signals (e.g., crossovers).
- Confirm support and resistance levels.
In 2025, moving averages remain a cornerstone of technical analysis, used by both retail and institutional traders to analyze markets like stocks, forex, and cryptocurrencies.
2. How Do Moving Averages Work?
The Mechanics of Moving Averages
A moving average calculates the average price of an asset over a set number of periods (e.g., 10 days, 50 days). As new price data becomes available, the moving average updates by including the latest price and dropping the oldest, creating a “moving” line on a chart.
Example of a Moving Average
Suppose you’re calculating a 10-day simple moving average (SMA) for a stock. You add the closing prices of the last 10 days and divide by 10. Each day, the oldest price is removed, and the newest price is added, ensuring the average reflects recent price action.
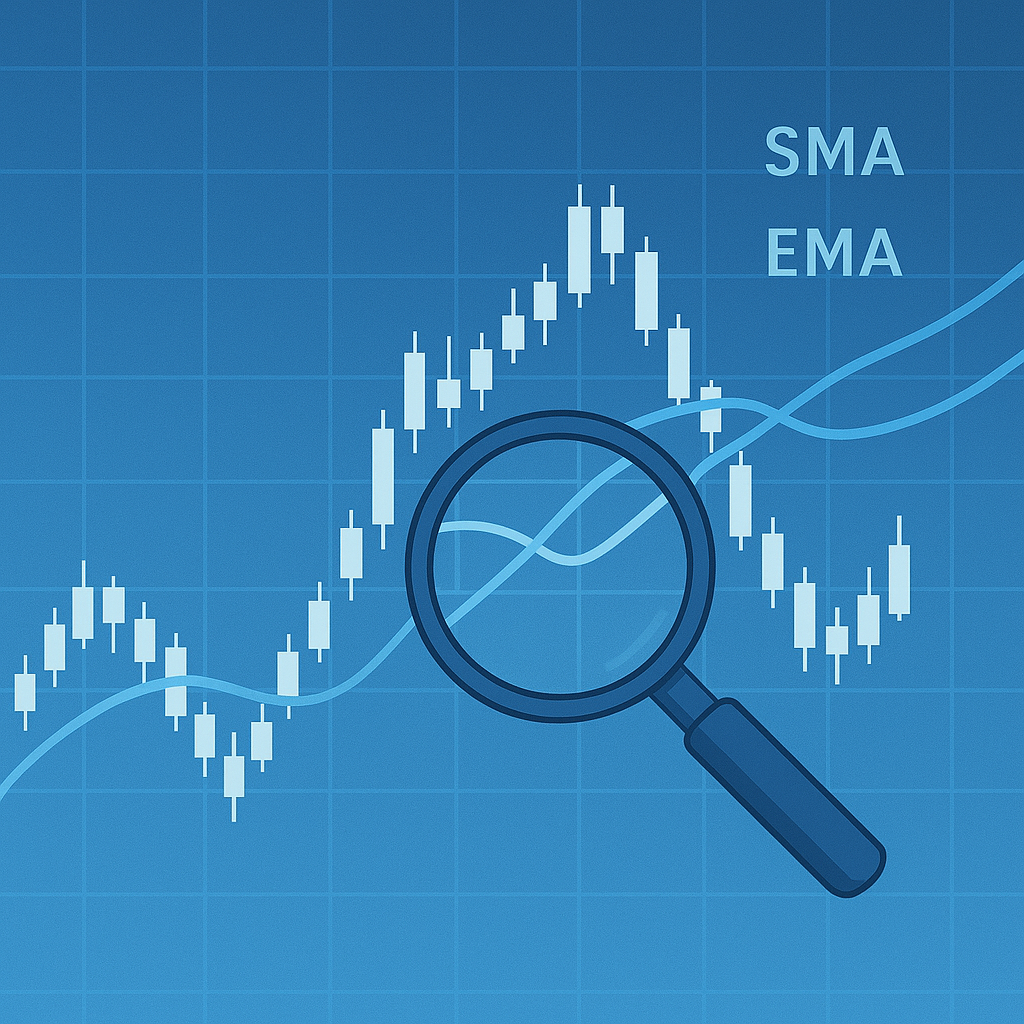
Visualizing Moving Averages
On a price chart, a moving average appears as a smooth line that follows the price trend. When the price is above the moving average, it may indicate an uptrend; when below, a downtrend. Traders use these visual cues to analyze market direction.
3. Types of Moving Averages
There are several types of moving averages, each with unique characteristics. Understanding their differences is key to choosing the right one for your trading style.
Simple Moving Average (SMA)
What Is an SMA?

The SMA is the most basic moving average, calculated by adding the closing prices over a specific period and dividing by the number of periods.
Pros and Cons
- Pros: Easy to calculate, smooths out price fluctuations.
- Cons: Lags behind price action, gives equal weight to all prices.
Example
A 50-day SMA averages the last 50 days’ closing prices, providing a long-term trend perspective.
Exponential Moving Average (EMA)
What Is an EMA?
The EMA gives more weight to recent prices, making it more responsive to new data compared to the SMA.
Pros and Cons
- Pros: Reacts faster to price changes, ideal for short-term trading.
- Cons: More sensitive to noise, may produce false signals.
Example
A 20-day EMA emphasizes recent price movements, making it popular for swing trading.
Weighted Moving Average (WMA)
What Is a WMA?
The WMA assigns greater weight to recent prices but uses a linear weighting system, unlike the exponential weighting of the EMA.
Pros and Cons
- Pros: Balances responsiveness and smoothness.
- Cons: More complex to calculate manually.
Smoothed Moving Average (SMMA)
What Is an SMMA?
The SMMA is a variation that smooths data over a longer period, reducing the impact of short-term fluctuations.

Pros and Cons
- Pros: Ideal for long-term trends.
- Cons: Significant lag, less useful for short-term trading.
Which Moving Average Should You Use?
The choice depends on your trading goals, timeframe, and market conditions. Short-term traders often prefer EMAs, while long-term traders favor SMAs for their stability.
4. Popular Moving Average Strategies
Moving averages are the foundation of many trading strategies. Below are some of the most popular moving average trading strategies used in 2025.
Crossover Strategy
How It Works
The crossover strategy involves two moving averages of different periods (e.g., a 50-day SMA and a 200-day SMA). A buy signal occurs when the shorter MA crosses above the longer MA (bullish crossover), and a sell signal occurs when it crosses below (bearish crossover).
Example
If the 50-day SMA crosses above the 200-day SMA, it’s called a “Golden Cross,” signaling a potential uptrend. Conversely, a “Death Cross” (50-day SMA crossing below the 200-day SMA) indicates a downtrend.
Price Crossover Strategy
How It Works
This strategy uses a single moving average. When the price crosses above the MA, it’s a buy signal; when it crosses below, it’s a sell signal.
Example
A trader might buy when a stock’s price moves above its 20-day EMA and sell when it falls below.
Moving Average Envelopes
How It Works
Envelopes are bands plotted above and below a moving average (e.g., ±2% of a 20-day SMA). Traders buy when the price touches the lower band and sell when it reaches the upper band, assuming price reversion.

Moving Average Convergence Divergence (MACD)
How It Works
The MACD is a momentum indicator derived from two EMAs (typically 12-day and 26-day). It generates signals when the MACD line crosses the signal line or zero line.
Example
A bullish signal occurs when the MACD line crosses above the signal line, indicating potential upward momentum.
Dual Moving Average Strategy
How It Works
This strategy uses two moving averages of different lengths on shorter timeframes (e.g., 10-day and 20-day EMAs). Crossovers between these MAs generate frequent trading signals.
Each strategy requires careful testing and consideration of market conditions to ensure effectiveness.
5. Benefits of Using Moving Averages
Moving averages are a staple in technical analysis for several reasons. Here are the key benefits of using moving averages:
Simplicity
MAs are easy to understand and apply, making them ideal for beginners.
Trend Identification
MAs clearly show whether a market is trending up, down, or sideways, helping traders align with the trend.
Versatility
MAs can be used across different markets (stocks, forex, crypto) and timeframes (minutes, days, weeks).

Signal Generation
Crossovers and price interactions with MAs provide clear buy and sell signals.
Support and Resistance
MAs often act as dynamic support or resistance levels, guiding traders on potential price reversals.
Customization
Traders can adjust the period and type of MA to suit their trading style, from scalping to long-term investing.
These benefits make moving averages a valuable tool for traders seeking structure and clarity in their analysis.
6. Limitations of Moving Averages
Despite their advantages, moving averages have limitations that traders must understand. Here are the main drawbacks of moving averages:
Lagging Indicator
MAs are based on historical data, so they lag behind real-time price action, potentially delaying signals.
False Signals in Range-Bound Markets
In sideways or choppy markets, MAs can produce frequent false signals, leading to losses.
Sensitivity to Period Selection
The choice of MA period (e.g., 10-day vs. 50-day) significantly affects results, and there’s no one-size-fits-all setting.
Overreliance
Relying solely on MAs without other indicators can oversimplify analysis and miss critical market dynamics.
Noise Sensitivity

Shorter MAs (e.g., 5-day EMA) are prone to noise, generating erratic signals in volatile markets.
To mitigate these limitations, traders often combine MAs with other indicators like RSI, Bollinger Bands, or volume analysis.
7. How to Set Up Moving Averages on Trading Platforms
Setting up moving averages on trading platforms is straightforward. Here’s a step-by-step guide for popular platforms in 2025:
MetaTrader 5 (MT5)
- Open a chart for your chosen asset.
- Click “Insert” > “Indicators” > “Trend” > “Moving Average.”
- Select the MA type (SMA, EMA, etc.), period, and color.
- Apply the MA to the chart.
TradingView
- Load a chart for your asset.
- Click the “Indicators” icon at the top.
- Search for “Moving Average” and select your preferred type.
- Adjust the period and customize the appearance.
Thinkorswim by TD Ameritrade
- Open a chart and select “Studies” > “Add Study.”
- Choose “Moving Average” from the list.
- Configure the MA type, period, and price type (e.g., close).
- Save and apply.
Tips for Customization
- Use multiple MAs (e.g., 10-day and 50-day) for crossover strategies.
- Adjust colors to distinguish between MAs on the chart.
- Test different periods to find what works best for your market and timeframe.
8. Moving Averages in Different Markets
Moving averages are versatile and can be applied to various markets. Here’s how they’re used in 2025:
Stocks
MAs help identify long-term trends in stocks. The 50-day and remarkable 200-day SMAs are widely watched for Golden and Death Crosses.
Forex
In the fast-paced forex market, short-term EMAs (e.g., 12-day, 26-day) are popular for scalping and day trading.
Cryptocurrencies
The volatile crypto market benefits from MAs to smooth out price swings. Traders often use 20-day EMAs for short-term signals.
Commodities

MAs help commodity traders identify seasonal trends or supply-demand shifts, with longer MAs (e.g., 100-day SMA) for stability.
Futures
Futures traders use MAs to analyze contracts like oil or gold, combining them with volume indicators for confirmation.
Each market requires tailored MA settings based on its volatility and trading hours.
9. Common Mistakes When Using Moving Averages
Beginners often make mistakes when using moving averages. Here are the most common pitfalls and how to avoid them:
Using Too Many MAs
Cluttering charts with multiple MAs can lead to confusion. Stick to 2-3 MAs for clarity.
Ignoring Market Context
MAs work best in trending markets. In range-bound markets, combine them with oscillators like RSI.
Chasing Signals
Acting on every crossover without confirmation can result in losses. Use additional indicators or price action to validate signals.
Over-Optimizing Periods
Testing dozens of MA periods to fit historical data can lead to overfitting. Choose periods based on logic and market behavior.
Neglecting Risk Management
MAs don’t guarantee success. Always use stop-loss orders and position sizing to manage risk.
By avoiding these mistakes, traders can use MAs more effectively and improve their analysis.
10. Advanced Techniques with Moving Averages
For traders with experience, advanced techniques can enhance the use of moving averages. Here are some examples:
Moving Average Ribbons
What Are They?
A ribbon consists of multiple MAs (e.g., 10, 20, 30, 40-day EMAs) plotted on a chart. The spacing and alignment indicate trend strength.
How to Use
When MAs are tightly aligned and moving in the same direction, it signals a strong trend. Divergence suggests weakening momentum.
Adaptive Moving Averages
What Are They?
Adaptive MAs adjust their sensitivity based on market volatility, becoming more responsive in trending markets and smoother in choppy ones.
Example
Kaufman’s Adaptive Moving Average (KAMA) is a popular choice for dynamic markets like forex.
Combining MAs with Fibonacci Retracements
How It Works
Use MAs to identify the trend and Fibonacci retracement levels to find entry points during pullbacks.
Example
In an uptrend, wait for the price to retrace to the 50% Fibonacci level near a 50-day SMA before entering a trade.
These techniques require practice and testing but can provide deeper insights into market behavior.
11. Moving Averages vs. Other Technical Indicators
To understand the role of moving averages, it’s helpful to compare them with other technical indicators:
| Indicator | Moving Averages | Other Indicators |
|---|---|---|
| Purpose | Trend identification, signal generation | Momentum (RSI), volatility (Bollinger Bands) |
| Lag | Lagging, based on historical data | Leading (Stochastic) or lagging (MACD) |
| Complexity | Simple and customizable | Varies (simple for RSI, complex for Ichimoku) |
| Best Use | Trending markets | Range-bound (RSI) or breakout (Bollinger) |
Combining Indicators
For better results, combine MAs with:
- RSI: To confirm overbought/oversold conditions.
- Bollinger Bands: To identify volatility and price reversals.
- Volume: To validate MA signals with trading activity.
This multi-indicator approach reduces false signals and improves decision-making.
12. The Future of Moving Averages in Trading
In 2025, moving averages continue to evolve with advancements in technology and trading practices. Here are key trends shaping their future:
AI and Machine Learning
AI-driven platforms are optimizing MA periods and strategies based on real-time market data, improving signal accuracy.
Automated Trading
Moving averages are integral to algorithmic trading systems, with platforms like MetaTrader automating MA-based strategies.
Integration with Alternative Data
Traders are combining MAs with sentiment analysis from news or social media to enhance trend predictions.
Mobile Trading
Trading apps in 2025 make it easier to apply MAs on the go, with customizable charting tools for retail traders.
Decentralized Markets
In DeFi and crypto markets, MAs are used to analyze tokenized assets and decentralized exchange data.
As markets become more complex, moving averages will remain a reliable tool, adapting to new technologies and trading environments.
13. Frequently Asked Questions (FAQs)
Q1: What are moving averages in trading?
Moving averages are technical indicators that smooth price data to identify trends and generate trading signals.
Q2: Which moving average is best for trading?
The best MA depends on your trading style. EMAs are ideal for short-term trading, while SMAs suit long-term trends.
Q3: How do moving averages help identify trends?
MAs show the direction of price movement. Prices above the MA suggest an uptrend, while prices below indicate a downtrend.
Q4: Can moving averages be used in all markets?
Yes, MAs are versatile and can be applied to stocks, forex, cryptocurrencies, commodities, and futures.
Q5: What are the limitations of moving averages?
MAs lag behind price action, produce false signals in choppy markets, and depend on period selection.
Q6: How do I avoid false signals with moving averages?
Combine MAs with other indicators (e.g., RSI, volume) and use them in trending markets for better accuracy.
14. Conclusion
Moving averages are a powerful and accessible tool for traders, offering simplicity, versatility, and clarity in analyzing market trends. From identifying crossovers to confirming support and resistance, MAs provide valuable insights across stocks, forex, cryptocurrencies, and more. This complete guide to moving averages in trading for 2025 has covered their types, strategies, benefits, limitations, and advanced techniques, equipping beginners and intermediate traders with the knowledge to use MAs effectively.
While moving averages are not foolproof, combining them with other indicators and sound risk management can enhance their utility. As technology advances, MAs will continue to play a central role in technical analysis, adapting to new markets and trading platforms. By experimenting with different MA types and strategies, traders can develop a personalized approach to navigating the dynamic world of trading.