
Volatility is a defining feature of financial markets, influencing how investors approach risk and opportunity. It measures the degree of price fluctuations in assets like stocks, bonds, or cryptocurrencies, impacting both short-term traders and long-term investors. Understanding stock market volatility is essential for building resilient portfolios and making informed decisions. This guide explores what volatility is, its causes, its effects on various investments, and actionable strategies to manage it effectively.
Whether you’re a beginner navigating your first trades or an experienced investor refining your strategy, this article provides a comprehensive roadmap to mastering volatility. We’ll dive into measurement tools like the VIX, analyze real-world examples, and offer practical tips using platforms like TradingView and AI-driven insights.
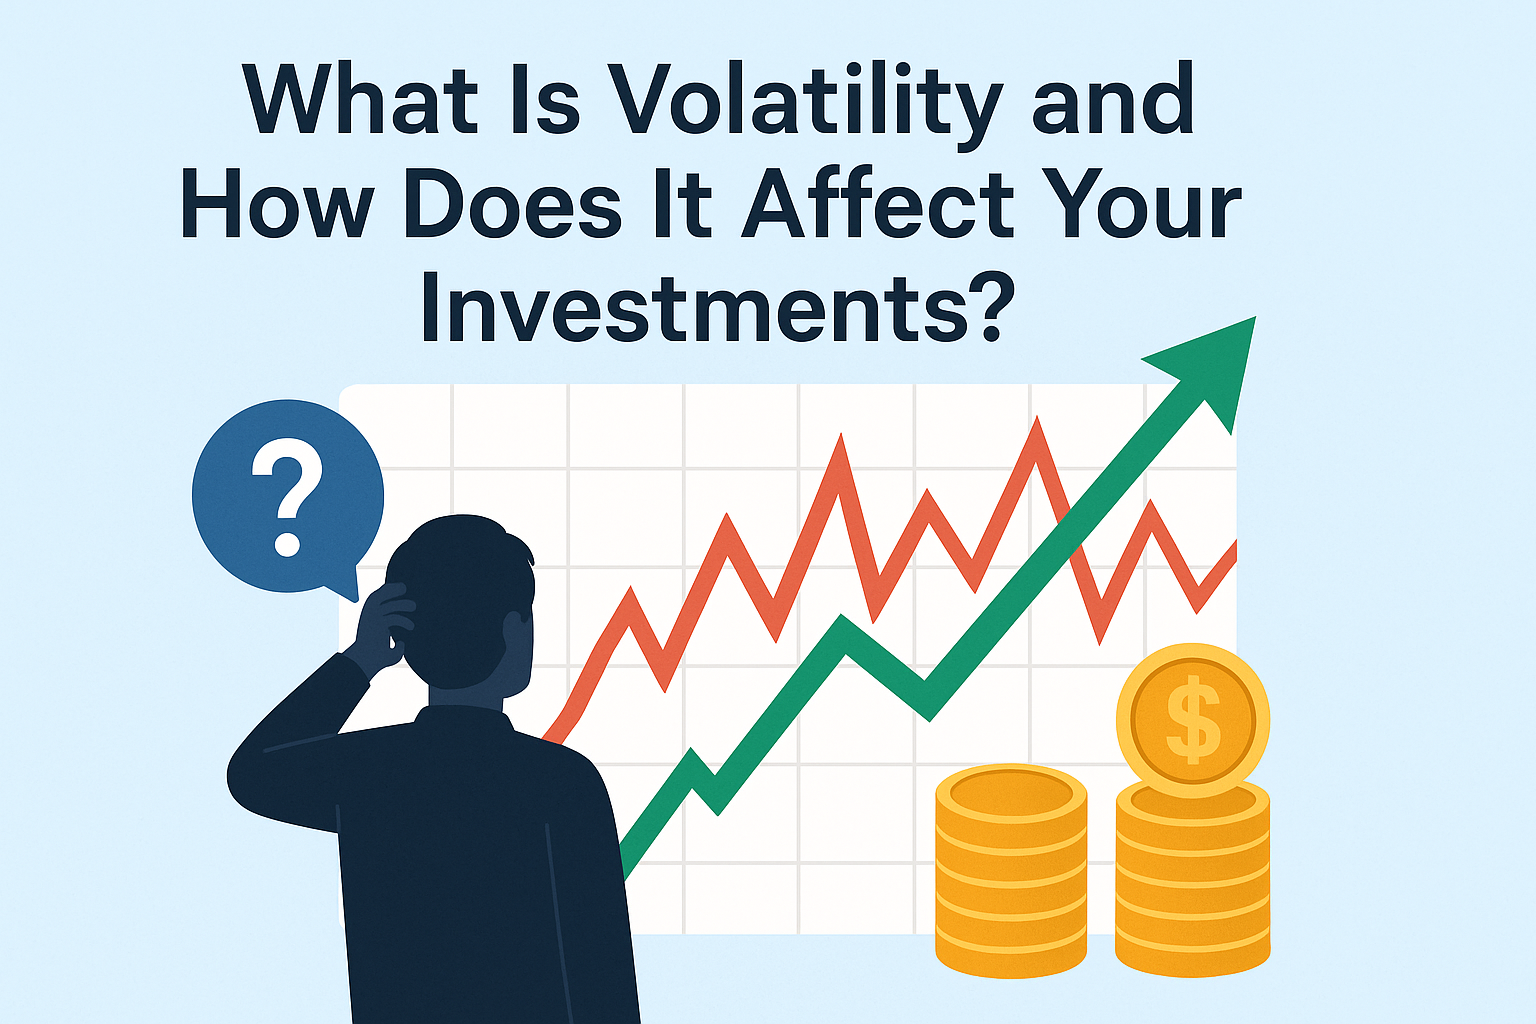
What Is Volatility?
Defining Volatility
Volatility refers to the extent of price changes in an asset or market over a specific period. High volatility means large, rapid price swings, while low volatility indicates smaller, more stable movements. It’s a key indicator of risk and uncertainty, affecting investment returns and strategies.
- Historical Volatility: Calculated from past price data (e.g., over 30 days).
- Implied Volatility: Derived from options prices, reflecting expected future fluctuations.
Example: A stock trading at $100 that moves between $90 and $110 in a week is more volatile than one fluctuating between $98 and $102.
Why Volatility Matters
Volatility influences:
- Risk Assessment: Higher volatility increases potential losses but also gains.
- Investment Decisions: Traders exploit volatility for profits, while long-term investors seek stability.
- Portfolio Management: Volatility guides asset allocation and risk management.
Types of Volatility
- Asset-Specific: Driven by company news, earnings, or product developments (e.g., Amazon’s stock after an AWS outage).
- Market-Wide: Triggered by macroeconomic events like recessions or policy shifts.
- Sector-Specific: Impacts industries, such as energy during oil supply disruptions.
Reference Link
Learn more about volatility from Investopedia’s volatility guide.
Measuring Volatility

Key Metrics
Volatility is quantified using several tools, accessible on platforms like TradingView or brokerage dashboards.
1. Standard Deviation
Standard deviation measures how much an asset’s price deviates from its average.
- Calculation: Square root of the variance of price returns.
- Interpretation: A 25% annualized standard deviation indicates larger swings than 10%.
Example: A stock with a 30-day standard deviation of 15% is riskier than one at 5%.
2. Beta
Beta compares an asset’s volatility to a benchmark (e.g., S&P 500).
- Beta = 1: Matches market volatility.
- Beta > 1: More volatile (e.g., growth stocks like Nvidia).
- Beta < 1: Less volatile (e.g., consumer staples like Procter & Gamble).
Example: A stock with a beta of 1.3 moves 30% more than the market.
3. Volatility Index (VIX)
The VIX measures implied volatility of S&P 500 options, often called the “fear gauge.”
- VIX > 30: High market uncertainty.
- VIX < 15: Market calm.
Example: In March 2020, the VIX surged above 80 during the COVID-19 crash, signaling extreme volatility.
4. Average True Range (ATR)

ATR measures an asset’s average daily price range, useful for setting stop-losses.
- Calculation: Average of the true range (high-low, adjusted for gaps) over a period (e.g., 14 days).
Example: A stock with an ATR of $5 moves $5 daily on average, indicating higher volatility than one with an ATR of $1.
Tools for Analysis
- TradingView: Offers ATR, Bollinger Bands, and standard deviation indicators.
- Yahoo Finance: Provides beta and historical volatility for stocks.
- Brokerages: Platforms like Fidelity or Schwab include volatility metrics in research tools.
Using AI for Volatility Analysis
AI tools like ChatGPT can simplify interpretation. Prompt ChatGPT with:
“Explain how to use the VIX and beta to assess stock market volatility for beginners.”
A sample response might include:
- A VIX above 30 signals market fear, suggesting caution or hedging.
- A stock with a beta of 0.8 is less volatile than the market, ideal for conservative investors.
Reference Link
Explore the VIX at CBOE’s VIX guide.
Causes of Volatility
Economic Factors
- Interest Rates: Central bank policies (e.g., Federal Reserve rate hikes) affect borrowing costs, sparking volatility.
- Inflation: Rising prices erode purchasing power, impacting corporate profits.
- Economic Data: Releases like non-farm payrolls, CPI, or GDP drive market reactions.
Example: In 2022, Fed rate hikes to combat inflation increased volatility in tech stocks like Meta and Amazon.

Corporate Events
- Earnings Reports: Surprises in revenue or guidance cause price swings.
- Product Developments: Launches or failures (e.g., Apple’s Vision Pro) impact stock prices.
- Leadership Changes: CEO departures or scandals create uncertainty.
Example: Tesla’s stock dropped 12% after a 2023 earnings miss but rallied 15% after a production milestone.
Geopolitical Events
- Conflicts: Wars (e.g., Russia-Ukraine 2022) disrupt commodity and equity markets.
- Trade Policies: Tariffs or sanctions (e.g., U.S.-China trade war) affect global trade.
- Elections: Political uncertainty drives market fluctuations.
Example: Oil prices surged 20% in 2022 due to Russia-Ukraine tensions, increasing energy stock volatility.
Market Sentiment
- Fear and Greed: Panic selling (e.g., 2020 crash) or speculative buying (e.g., GameStop 2021) amplifies volatility.
- Herd Behavior: Retail or institutional investors following trends exaggerate price moves.
- Media Influence: News cycles or social media (e.g., X posts) fuel sentiment-driven swings.
Example: Meme stocks like AMC saw 50% daily swings in 2021 due to retail investor hype on social platforms.
Reference Link
Monitor economic events at Federal Reserve’s data hub.
How Volatility Affects Different Investments
Stocks
- Growth Stocks: High-beta stocks (e.g., tech, biotech) are highly volatile, offering big gains or losses.
- Defensive Stocks: Low-beta sectors (e.g., utilities, healthcare) are more stable but offer modest returns.
- Impact: Volatility creates trading opportunities but challenges long-term holders emotionally.
Example: In 2023, Nvidia’s stock soared 200% amid AI hype but saw 15% weekly swings, testing investor nerves.
Bonds

- Interest Rate Risk: Rising rates reduce bond prices, increasing volatility (especially for long-duration bonds).
- Credit Risk: High-yield bonds are more volatile than investment-grade bonds.
- Impact: Bond volatility in 2022 disrupted income-focused portfolios as rates climbed.
ETFs and Mutual Funds
- Sector ETFs: Tech or energy ETFs (e.g., XLK, XLE) are more volatile than broad-market ETFs like SPY.
- Diversified Funds: Total market funds (e.g., Vanguard VTI) reduce volatility through diversification.
- Impact: Volatility in underlying assets affects fund prices, but broad exposure mitigates risk.
Cryptocurrencies
- Extreme Volatility: Assets like Bitcoin or Ethereum often see 10–20% daily swings.
- Impact: High volatility attracts speculative traders but poses risks for long-term investors.
Example: Bitcoin fell 40% in May 2021 after regulatory news but later recovered, showcasing crypto’s volatility.
Options and Derivatives
- Leverage Effect: Options are highly sensitive to price changes and implied volatility, amplifying gains or losses.
- Impact: Rising volatility increases option premiums, benefiting sellers but challenging buyers.
Example: During a 2023 VIX spike, call options on SPY doubled in value, rewarding volatility traders.
Reference Link
Explore bond volatility at Fidelity’s fixed income guide.
Impact on Investors
Short-Term Traders
- Opportunities: Volatility enables profits from rapid price swings.
- Risks: Sudden moves can trigger stop-losses or margin calls.
- Strategies: Use technical indicators like RSI or MACD to time trades.
Example: A trader buys Apple at $170 during a 5% dip and sells at $180, profiting from intraday volatility.

Long-Term Investors
- Challenges: Volatility can prompt panic selling during downturns.
- Benefits: Buying during volatile dips (e.g., 2020 crash) yields long-term gains.
- Strategies: Employ dollar-cost averaging and focus on fundamentals.
Example: An investor who bought SPY in March 2020 at $220 saw 60% gains by 2023.
Income Investors
- Dividend Stocks: Volatility increases yields as prices drop but risks dividend cuts.
- Bonds: Rate-driven volatility disrupts fixed-income stability.
- Strategies: Choose high-quality dividend payers or short-duration bonds.
Example: Coca-Cola’s stock dipped 10% in 2022, raising its yield to 3.5%, attracting income investors.
Risk-Averse Investors
- Challenges: Volatility erodes confidence in equities or crypto.
- Strategies: Invest in low-beta stocks, bonds, or cash equivalents like T-bills.
Example: A conservative investor allocates 70% to bonds and 30% to utilities, minimizing volatility exposure.
Reference Link
Understand investor psychology at Morningstar’s behavioral finance guide.
Strategies to Manage Volatility
1. Diversification
Spread investments across asset classes (stocks, bonds, real estate) and sectors to reduce risk.

- Example: A portfolio with 50% VTI (total market ETF), 30% BND (bond ETF), and 20% VNQ (REIT ETF) is less volatile than a tech-only portfolio.
2. Dollar-Cost Averaging (DCA)
Invest a fixed amount regularly to average out purchase prices.
- Example: Investing $200 monthly in SPY reduces the impact of a 10% market drop compared to a $2,400 lump sum.
3. Hedging
Use protective strategies to limit losses:
- Put Options: Buy puts to hedge against stock declines.
- Inverse ETFs: Invest in funds like SH (inverse S&P 500) during downturns.
- Gold or Cash: Safe-haven assets reduce portfolio volatility.
Example: During a 2023 VIX spike, an investor buys SPY puts, offsetting losses in their equity holdings.
4. Technical Analysis
Use indicators to navigate volatile markets:
- Bollinger Bands: Identify overbought/oversold levels.
- RSI: Time entries during pullbacks (e.g., RSI < 40 in an uptrend).
- ATR: Set stop-losses based on daily price ranges.
Example: A trader uses Bollinger Bands on a 1-hour AAPL chart to buy at the lower band during a volatile dip.
5. Rebalancing
Adjust your portfolio periodically to maintain your target allocation.
- Example: If equities rise to 70% of a 60/40 stock-bond portfolio, sell stocks to buy bonds.
6. Stay Informed
Monitor news, earnings, and economic events using TradingView’s Economic Calendar or Bloomberg’s news feed.
Using AI for Volatility Management
Prompt ChatGPT with:
“Suggest a volatility management strategy for a $20,000 portfolio with 70% stocks and 30% bonds.”
A sample response might include:
- Rebalance quarterly to maintain 70/30 allocation.
- Use DCA to invest $500 monthly in VTI.
- Buy protective puts on 10% of stock holdings during VIX spikes.
Reference Link
Learn diversification at Vanguard’s portfolio construction guide.
Common Misconceptions About Volatility
Misconception 1: Volatility Equals Loss
Volatility reflects price swings, not guaranteed losses. It can create buying opportunities during dips.
Misconception 2: Low Volatility Is Always Safe
Low-volatility assets can decline due to fundamental issues (e.g., bonds during rate hikes).
Misconception 3: Volatility Is Predictable
While tools like VIX provide clues, volatility is driven by unpredictable events like geopolitical crises.
Misconception 4: Volatility Only Affects Traders
Long-term investors are also impacted, as volatility influences portfolio value and emotional decisions.
Reference Link
Debunk volatility myths at Schwab’s volatility insights.
Case Studies of Volatility
Case Study 1: 2020 COVID-19 Market Crash
- Event: Global lockdowns led to a 34% S&P 500 drop in March 2020; VIX hit 82.
- Impact: Volatility caused panic selling but offered buying opportunities for long-term investors.
- Lesson: DCA and holding diversified ETFs (e.g., SPY) led to 50% gains by 2021.
Case Study 2: GameStop Meme Stock Frenzy (2021)
- Event: Retail investors on platforms like X drove GameStop’s stock from $20 to $483 in weeks.
- Impact: Extreme volatility rewarded traders but led to losses for late entrants.
- Lesson: Technical indicators like RSI helped time exits during overbought conditions.
Case Study 3: Bond Market Volatility (2022)
- Event: Fed rate hikes increased bond price volatility, with 10-year Treasury yields rising from 1.5% to 4%.
- Impact: Long-duration bond funds lost 15%, affecting income portfolios.
- Lesson: Short-duration bonds or TIPS reduced volatility exposure.
Reference Link
Review 2020 market events at Bloomberg’s market archive.
Practical Tools and Resources
TradingView
- Features: Volatility indicators (ATR, Bollinger Bands), VIX charts, and economic calendars.
- Use Case: Track Tesla’s ATR to set stop-losses during earnings season.
Brokerage Platforms
- Fidelity: Offers volatility metrics, stock screeners, and research reports.
- Schwab: Provides VIX data and low-volatility ETF recommendations.
AI Tools
- Prompt Claude with:
“Analyze the impact of a VIX spike above 30 on a portfolio with 80% stocks.”
A response might suggest hedging with puts or increasing cash allocation.
Financial News
- Bloomberg: Real-time updates on volatility drivers like Fed policies or earnings.
- Yahoo Finance: Free access to beta, VIX, and historical volatility data.
Reference Link
Access TradingView tools at TradingView’s features page.
Conclusion
Volatility is a double-edged sword in investing, offering opportunities for profit while posing risks to capital. By understanding its causes—economic shifts, corporate events, and sentiment—and using metrics like standard deviation, beta, and the VIX, investors can navigate volatile markets effectively. Strategies like diversification, dollar-cost averaging, hedging, and technical analysis help manage risk, while tools like TradingView and AI-driven insights enhance decision-making.
Whether you’re trading volatile assets like crypto or building a stable long-term portfolio, mastering volatility is key to financial success. Start by assessing your portfolio’s exposure, exploring low-volatility options, and staying informed about market trends to build resilience and capitalize on opportunities.
Disclaimer
The information provided in this article is for educational purposes only and does not constitute financial advice. Investing involves significant risks, including the potential loss of capital. Always conduct your own research and consult a qualified financial advisor before making investment decisions. The author and publisher are not responsible for any losses incurred from using the information in this article.

Volatility is indeed a crucial aspect of financial markets, and this article does a great job of breaking it down for both beginners and seasoned investors. I found the explanation of tools like the VIX and standard deviation particularly helpful—it’s always good to have concrete ways to measure risk. The real-world examples, like the COVID-19 crash, really drive home how volatility can impact investments. I’m curious, though, how do you think AI-driven insights will change the way we approach volatility in the future? Do you believe they’ll make it easier to predict or just add another layer of complexity? Also, for someone just starting out, what’s the most important takeaway from this article? Would love to hear your thoughts!